Binary decision diagram 🕸️
GitHub repository link DSA-BDD :)
DSA - C++ implementation of binary decision diagram
Intro
Binary decision diagram is a tree-like data structure, used to represent a Boolean function. When given certain combinations of input variables, it can resolve the output of this function for a given input quickly. Apart from ordinary BDD, there is also more efficient version, called reduced ordered binary decision diagram (ROBDD) which is similar to the ordinary one, except two differences:
- ROBDD does not have duplicate nodes with the same values.
- ROBDD also does not have nodes, where each child node is the same.
Implementation
There are two ways in which a BDD can be constructed. One of them is Shannon expansion and the other one is so-called vector decomposition. This implementation of BDD uses vector decomposition.
Converting disjunctive normal form to vector
In order to construct a BDD with vector decomposition, I needed to know the actual vector. In context, a vector is a string of results, for all combinations of input for a given boolean expression.
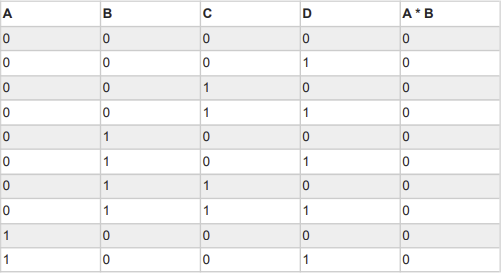
So for example, for a given Boolean expression A*B, and the given input variables A, B, C and D, the resulting vector would be 0000000000001111.
Therefore, I needed a way to evaluate the DNF expression, in order to get this vector. The function which does this is called calculateVector, and it expects two parameters - boolean expression and order of the unique variables which are used in this expression (both are types of string).
The way this function works is by generating all possible combinations of ones and zeros for each variable. I am representing ones and zeros in my code with a boolean data type. These combinations are then temporarily stored in a small boolean lookup table, where a single variable character’s ASCII code is used as an index, and the value is target bit for that specific combination.
bool variablesLookupTable[128];
stringstream outputVectorStream;

for (size_t n = 0; n < rowsCount; n++) {
  for (size_t v = 0; v < variablesCount; v++) {
    bool targetBit = ((n >> v) & 1);
    variablesLookupTable[(int) order[variablesCount - v - 1]] = targetBit;
  }
...
In the same iteration, I am then looping over every single character in the boolean expression from the input, and replacing every character with its target bit, which is stored in the lookup table mentioned above. So for example, for a given input A!BC+!DE!F, I will now have a string which looks something like this 0!10+!10!0. While replacing variables with their associated bits, I also checked whether an exclamation mark was in front of the variable, and if so, I negated its associated bit.
Right now, the form of this expression looks something like this 000+001. What I’m doing next is iterating every single character, multiplying it (using logical OR) with the bit buffer, which is a buffer which stores temporary value for each group of multiplied characters. When stumbled upon a plus character, this buffer is then added to the output vector bit (using logical OR) which is essentially a result of a given logical expression with the specific combination of input bits. One interesting thing is, once the value of the output vector bit is one, we can end this iteration, and go on to the next combination of bits. Simply because there is no way that our output vector bit will be changed by OR operation, once its value is logical one. This output bit is then streamed into the output stream object, which stores the whole vector for all of the combinations of bits for a given expression.
Constructing diagram
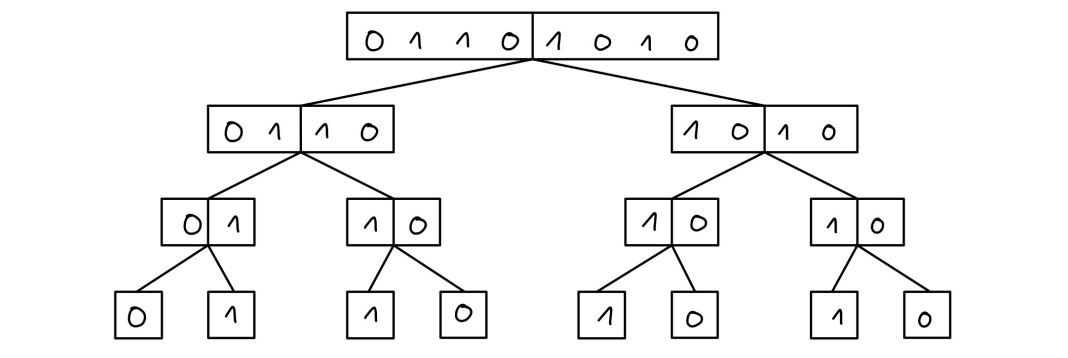
Once I get the vector, constructing a diagram is relatively easy. The only which needs to be done in theory, is to make a root node representing the vector, and divide this vector into a two parts, make a nodes for each of those parts, and connect this nodes to the parent node (left part of the vector to as a left child & right part of the vector as a right child). This construction continues for the child nodes as well, until the length of a vector is either logical 1 or 0 - these nodes are called terminal nodes.
One issue with this, is that the final diagram is not reduced, meaning that it contains duplicate nodes.
In order to have this diagram reduced, the following rules must be followed:
- Merge nodes which have the same vector.
- Delete nodes whose childs have the same vector.
Next illustration shows, how would such diagram look like:
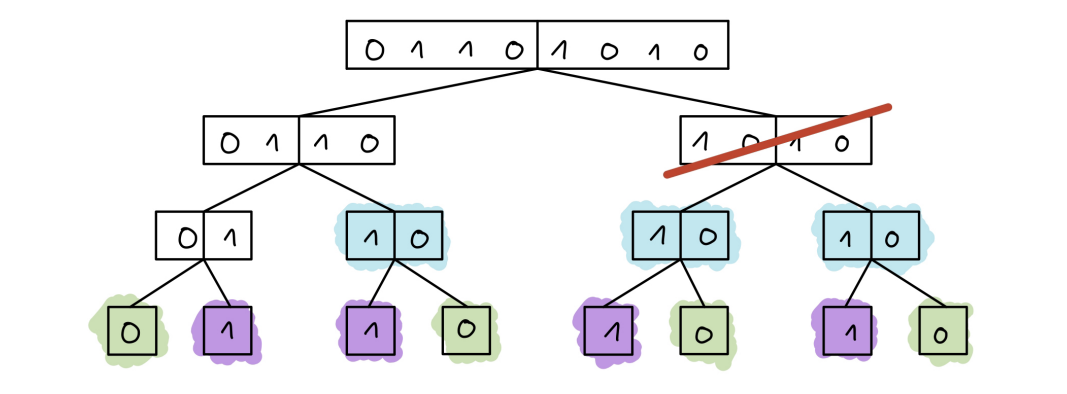
Nodes with the same color would be merged, and ones which are crossed would be removed, leading to the diagram which looks something like this:
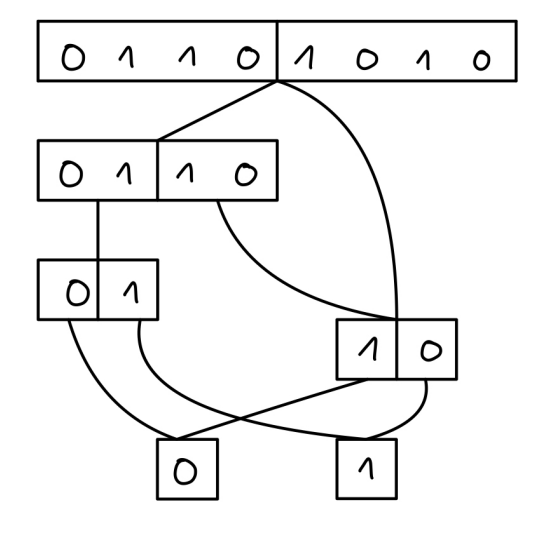
The way I approached this reduction was by determining what nodes will be in the reduced diagram, in advance, only by looking at the vector. The way I’m doing this is by repeatedly splitting vectors in halfs, and checking whether those halves are equal, and whether their halves are equal. If such a vector fulfills this criteria, it will be used to create a standalone node, with its according depth. This node is then stored in a map, where its vector is a key and the node itself is a value. I’ve used a map to make these lookups as quick as possible, since I will need them in the next phase, which is the actual construction of the diagram.
This procedure mostly consists of two functions: getClosestUniqueNode and constructDiagram. Function getClosesUniqueNode serves as a wrapper around the vector-node map, but with one key difference. If no node is found under a specific key, it means that this node was eliminated during the reduction phase. This tells us that the left side of the vector is equal to the right side, meaning that we can now split this vector in half, and try to use this half to find the closest unique node.
shared_ptr<Node> getClosestUniqueNode(string vector, map<string, shared_ptr<Node>>& vectorNodesMap) {
  if (vectorNodesMap.contains(vector)) {
    return vectorNodesMap[vector];
  }

  return getClosestUniqueNode(vector.substr(vector.length() / 2), vectorNodesMap);
}
Once this function was implemented, constructing the actual diagram is a fairly easy process which can be done recursively. The only exit condition is when the length of the vector is 1 which during this construction will happen eventually.
shared_ptr<Node> constructDiagram(string vector, map<string, shared_ptr<Node>>& vectorNodesMap) {
  const shared_ptr<Node> parent = getClosestUniqueNode(vector, vectorNodesMap);

  if (parent->vector.length() == 1) {
    return parent;
  }

  parent->left = constructDiagram(parent->vector.substr(0, parent->vector.length() / 2), vectorNodesMap);
  parent->right = constructDiagram(parent->vector.substr(parent->vector.length() / 2), vectorNodesMap);

  return parent;
}
After all of the steps above, we should have a fully reduced and functional BDD. The last thing I’m doing after creation, is just measuring the ratio between the number of all nodes and the number of nodes in the reduced diagram.
Using the BDD
Using this reduced BDD with a given input is a fairly simple process, which only consists of traversing this diagram to its end (terminal node), by deciding whether to go left or right, based on an input. One edge case which needs to be handled, is when a layer does not contain any node, meaning that there is no node for the depth we might be currently in while traversing. This can be simply handled just by ignoring current depth, and going onto the next layer.
char useDiagram(shared_ptr<Node>& diagram, const string& order) {
  auto root = diagram;

  for (size_t idx = 0; idx < order.length(); idx++) {
    if (idx != root->depth) {
      continue;
    }

    root = (order[idx] == '0') ? root->left : root->right;
  }

  return root->vector[0];
}
After the traversing is done, the resulting bit is returned based on the terminal node this algorithm has reached to. To fulfill the assignment criteria, this function is wrapped in BDD.use function. The only thing this function does, is that it ensures that the length of the given input is valid, otherwise the -1 is returned
Testing
Implementation
Requirements for the testing were that our expressions must contain at least 13 unique variables, and that we have to test at least 100 functions for each variable count. Considering these requirements, I’ve decided to make a test program which would generate unique boolean expressions, and for each of these expressions it would also create a BDD, and then it would test this BDD using BDD.use function. I have made this testing program in such a way that the key parameters are passed in as command line arguments, which in this case are the number of variables and the amount of functions this program should generate and test.
For generating, I made a function which would generate an FDNF boolean expression, which contains $\frac{2^n}{10}$ clauses, where n is the number of variables. and where each clause is unique, meaning that the amount of negations varies. After a function is generated, it is passed into BDD.create as well as its order. After the diagram is made, I am generating all possible combinations of ones and zeros, which are passed into the BDD.use function. I am saving each output of this function, and at the end of the testing, I am checking whether the resulting vector matches the one, which was internally used to generate the diagram. If these vectors are equal, it means that the diagram is valid, and that it represents the boolean function which was used to generate it.
Apart from tracking other information about every BDD creation, I am measuring the time for each important procedure. At the end of the testing cycle, the testing program will print out this data, in JSON format.
[
  {
    "expressionLength": 57,
    "vectorEvaluationDuration": 1.6454e-05,
    "diagramConstructionDuration": 1.3182e-05,
    "createDuration": 6.8228e-05,
    "useDuration": 3.754e-06,
    "nodesCountFull": 127,
    "reducedNodesCount": 19,
    "reductionRate": 85.0394,
    "vectorsAreEqual": 1
  },
...
Here is an example of what a sample of one BDD.create procedure looks like. The whole testing program returns these values as a JSON array. The reason why I chose JSON will be explained later on.
Automation
To make this testing as automatic as possible, I’ve decided to make a bash script which could run these tests in parallel, trying to utilize as much power as possible.
#!/bin/bash

# $1 min number of variables
# $2 max number of variables
# $3 number of functions per job
# $4 number of paralel jobs

for ((i = $1; i <= $2; i++))
do
  mkdir ./measurement/${i}_vars

  echo -e "Testing for" $i

  for ((j = 1; j <= $4; j++)) {
    ./bin/test $i $3 >>./measurement/${i}_vars/${i}v.${3}fn.${j}.json &
  }

  wait
done

zip -r measurement/measurement_${1}_${2}_${3}.zip measurement
Results of these testing programs are then stored in json files, which are stored in folders, where each folder name contains the number of variables used for testing. Resulting folder structure then looks something like this.
root@PC:/DSA/BDD/measurement/13_vars$ ls
13v.4fn.1.json   13v.4fn.13.json  13v.4fn.17.json  13v.4fn.20.json  13v.4fn.24.json  13v.4fn.5.json  13v.4fn.9.json
13v.4fn.10.json  13v.4fn.14.json  13v.4fn.18.json  13v.4fn.21.json  13v.4fn.25.json  13v.4fn.6.json
13v.4fn.11.json  13v.4fn.15.json  13v.4fn.19.json  13v.4fn.22.json  13v.4fn.3.json   13v.4fn.7.json
13v.4fn.12.json  13v.4fn.16.json  13v.4fn.2.json   13v.4fn.23.json  13v.4fn.4.json   13v.4fn.8.json
To make this testing even more versatile, I’ve decided to use docker to make this project easier to deploy and test on other linux machines as well (considering that the docker is installed on them). I’ve used ubuntu as my go-to image for testing to avoid any problems with build dependencies. Then, I’ve made a Dockerfile which downloads this image, copies all necessary files, installs g++ version 10 and zip and, compiles the code using compile.sh script, and then executes the resulting binary with given command line arguments. To run this container I’ve made a docker-rr.sh script which will kill any other BDD testing container, pass in command line arguments and mount the measurement folder as a volume, in order to have access to the JSON results printed out by tester.
After I’ve got this setup right, I’ve used 16-core VPS provided by DigitalOcean, where I cloned my repository and successfully started the docker container in which this testing program is running. I am running 25 threads, where each thread is generating and testing 4 boolean functions. I am doing this for the range of variables 6 - 20. Here is a screenshot I took while the test was running. It shows usage of each core on the server.
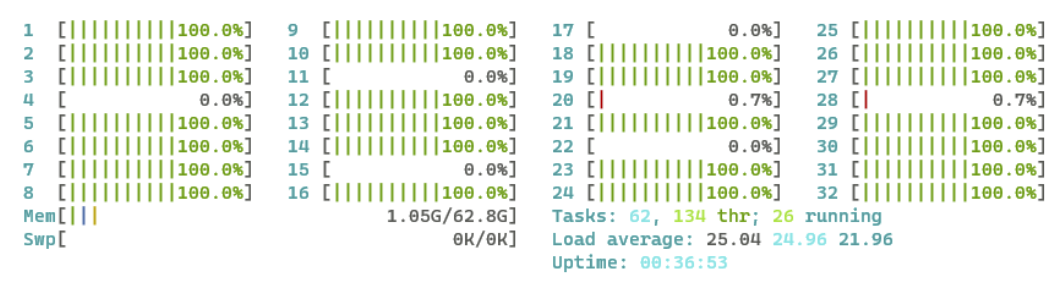
Just to clarify, I am not using white theme in my terminal, but I wanted it to blend better on a paper which I had to submit
After this testing is done, all of these results are zipped into one zip file, which I download from the server and used to make measurements and graphs for this documentation.
When it comes to working with the results, I needed a way to merge all of these files together, to form one set of measurements. For this, I’ve made a JavaScript script, which would read all of these JSON files stored in the measurement folder, deserialize them, calculate averages, and create a CSV file where averages are calculated for expression lengths, create and use durations and reduction rates. I have used the version 16 of Node.js environment to run this script locally on my machine. The final explanation of why I’ve used JSON is because it is a format which has native support in JavaScript, and therefore it is easier to work with data in such a format.
Results
Tables
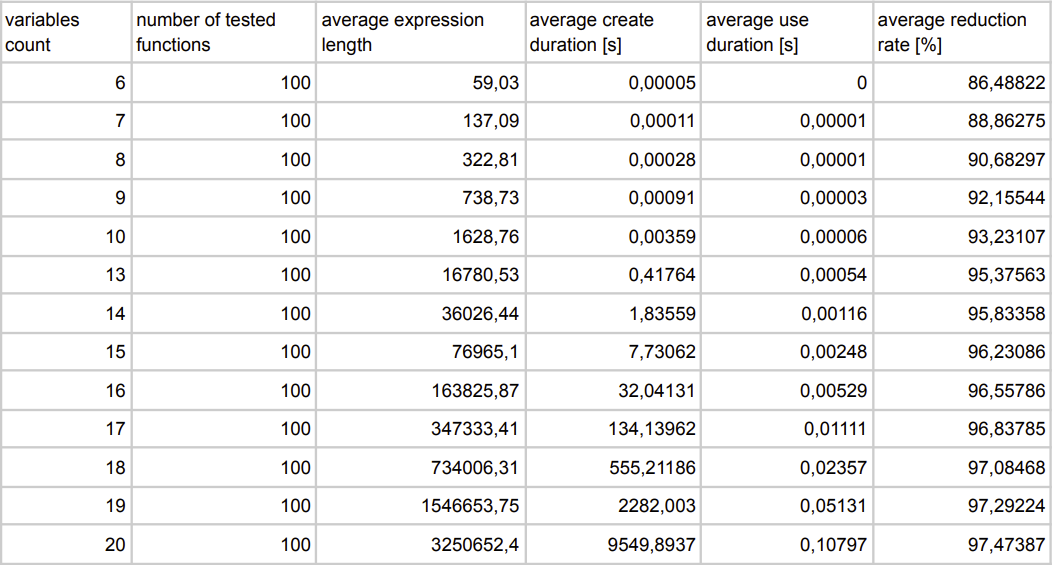
This is the output table generated by the script mentioned above, which already calculates the averages for each number of variable counts. The whole testing took around 15 hours.
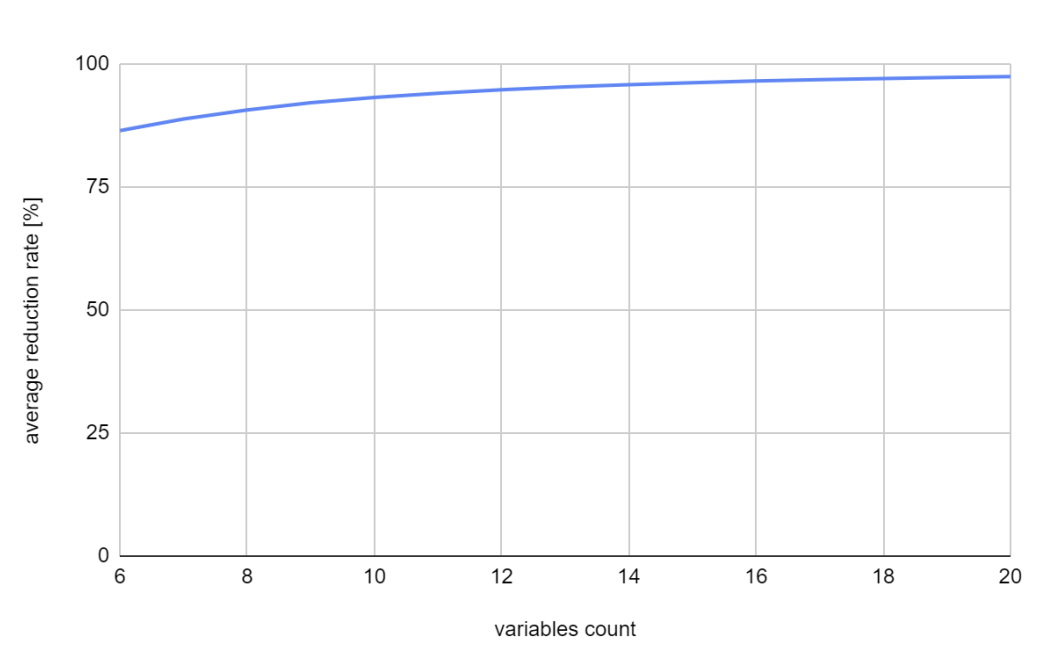
Charts
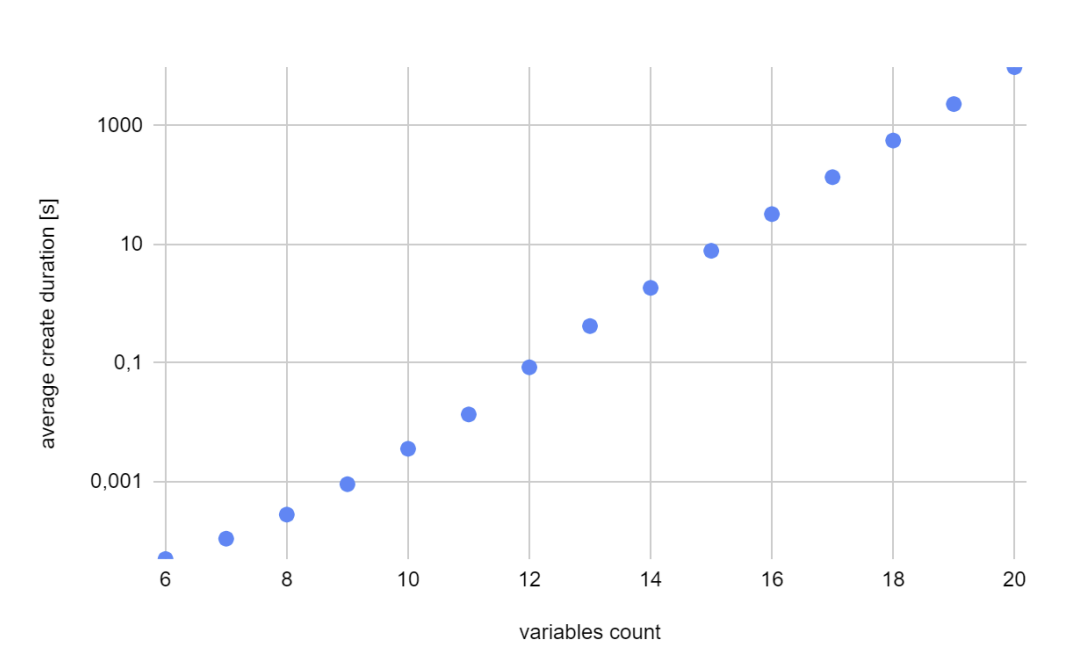
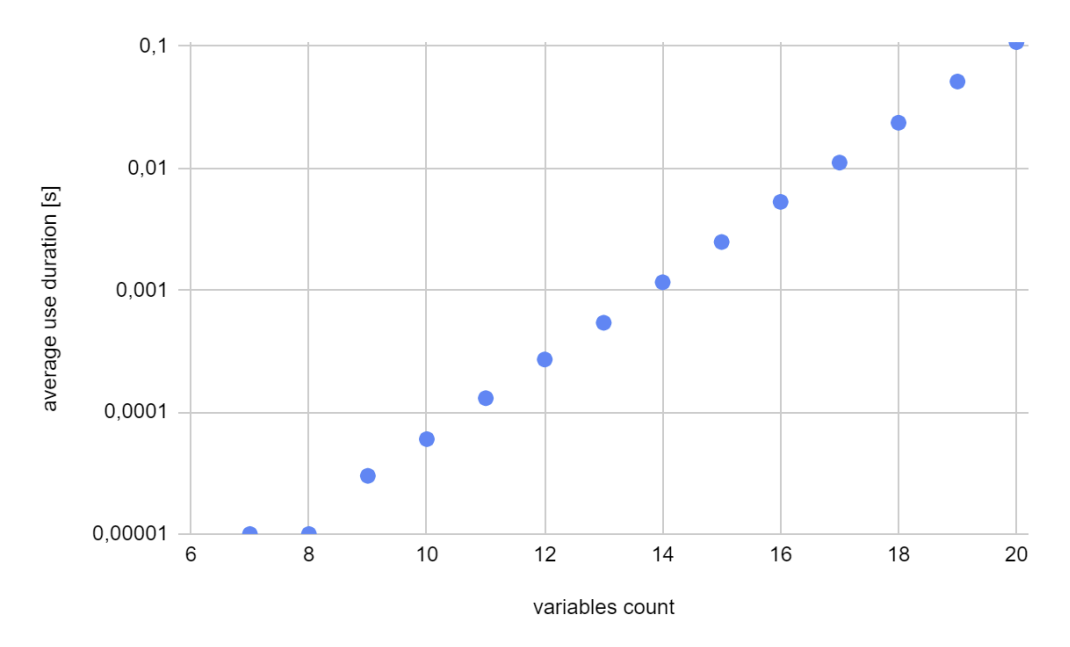
Since the nature of the first two graphs is exponential, I’ve decided to use logarithmic scale for the vertical axis.
Conclusion
Time complexity & Memory complexity
Estimated time complexity of BDD.create operation is $O(p\cdot(2^n))$, where p is the length of the boolean expression and n is the number of variables.
Reduction
My assumption of why the curve in the reduction rate graph is so steady is because the longer the vector is, the smaller amount of unique nodes it can hold.
Invalid inputs in BDD.use
The only two use cases when BDD.use can return -1 are:
- When the length of combinations is not equal to the number of variables used to construct this diagram
- When the input string contains characters other than ones and zeros. But since the testing is automated, both of these use cases never happen.
Reverse order hypothesis
To test whether the order matters for the same boolean expression, I made a small cpp program called order_test.cpp (will be included in the final zip file of this project) to test this. I have explicitly defined FDNF expression, and two orders of variables, where one order is reversed. After I compiled this program, I got the result, saying that the resulting vectors are not equal, so the order of variables does indeed matter.
#include <iostream>
#include <chrono>
#include <string.h>

#include "bdd.hpp"

using namespace std;

int main() {
  string expression = "AB!CD!EF!GH+A!BCDE!F!GH+A!B!CDE!FGH+AB!CDEF!GH+ABCDE!FGH+AB!CDEF!GH+A!BC!D!EF!GH+AB!C!DE!FG!H";
  string order = "ABCDEFGH";
  string reversedOrder = "HGFEDCBA";

  BDD bdd1;
  bdd1.create(expression, order);

  BDD bdd2;
  bdd2.create(expression, reversedOrder);

  if (bdd1.vector == bdd2.vector) {
    cout << "Vectors are equal" << endl;
  } else {
    cout << "Vectors are not equal" << endl;
  }

  return 0;
}